Uživatel:Tpmirchi/Biochemistry
 | Článek byl označen za rozpracovaný, od jeho poslední editace však již uplynulo více než 30 dní | |||
| Chcete-li jej upravit, pokuste se nejprve vyhledat autora v historii a kontaktovat jej. Podívejte se také do diskuse. | ||||
Pokud vše nasvědčuje tomu, že původní autor nebude v editacích v nejbližší době pokračovat, odstraňte šablonu {{Pracuje se}} a stránku upravte. | ||||
| Stránka byla naposledy aktualizována v úterý 14. května 2019 v 05:21. | ||||
General notes:
Usually your analyte + something gives us a colourful compound, the absorbance of which you measure. The concentration is then basically a simple cross-multiplication:
the concentration of standard solution (known)/absorbance of standard solution (you measure) = concentration of analyte (unknown)/absorbance of analyte (you measure)
Don't forget to calibrate with a blank solution before you measure! :)
Hemoglobin in blood
- Oxidation of hemoglobin to methemoglobin:
- HbFe2+ + [FeIII(CN)6]3- → HbFeIII + [FeII(CN)6]4-
- Conversion of methemoglobin to cyanmethemoglobin:
- HbFeIII + CN- → HbFeIIICN
Oxidation of ferrous iron in hemoglobin to ferric iron with potassium ferricyanide. The resulting methemoglobin is converted in the next reaction with potassium cyanide to a very stable cyanmethemoglobin with a broad absorption maximum at 540 nm.
Evaluation
The reference range is 130–180 g/l for adult males and 120–160 g/l for adult females.
↑ Dehydration
↓ Anemia
Estimation of total serum protein
The biuret reaction is used. Proteins form a violet complex with cupric salts in alkali, suitable for photometric estimation. The resulting complex of Cu2+ ions with peptidic bonds strongly absorbs light at 540-560 nm.
Hodnocení
Reference values: 65–85 g/l
↑
- Absolute
- Increased production of certain proteins e.g. in plasmocytoma
- Relative
- Dehydration
↓
- Absolute
- Loss by kidneys, GIT, skin (burns), bleeding, to the "third space" (e.g. ascites)
- Low protein biosynthesis (chronic liver disease)
- Insufficient intake of protein (malnutrition)
- Relative
- Hyperhydration - protein is diluted
Estimation of total serum bilirubin
Azo coupling reaction of billirubin with a diazonium salt, most often a diazotized sulfanilic acid.
- The acid is produced by van den Bergh diazoreaction - a reaction of sulfanilic acid with sodium nitrite in excess of HCl
- Bilirubin reacts with diazonium salt giving colourful azobilirubin -> direct spectrophotometry at 454 nm
- Fraction of bilirubin noncovalently bound to albumin requires an accelerator to give the reaction is called “indirect” bilirubin (alcohols, caffeine...)
Evaluation
total serum bilirubin up to 17 μmol/l
↑ jaundice - prehepatal, hepatal nebo posthepatal
Estimation of serum triacylglycerols
Several enzymatic reactions:
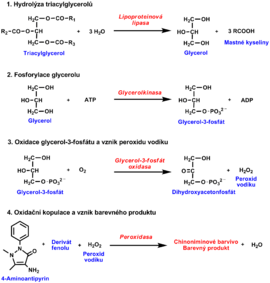
- Triacylglycerols are first hydrolyzed by lipoprotein lipase to produce glycerol and free fatty acids
- Glycerol is converted to glycerol-3 phosphate by glycerol kinase in the presence of ATP. In the next enzymatic reaction catalysed by glycerol-3-phosphate oxidase glycerol-3 phosphate is oxidised to produce dihydroxyacetone phosphate and H2O2.
- Finally, horseradish peroxidase uses the hydrogen peroxide for oxidation of a chromogen to yield a colour product, measurable spectrophotometrically.
Evaluation
reference range: 0,45–1,7 mmol/l
↑ lifestyle, after meal
↓ malnutrition
Estimation of total serum cholesterol
Several enzymatic reactions:
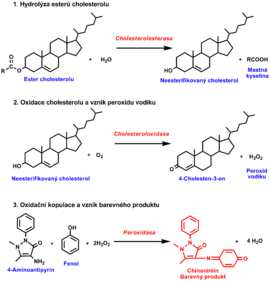
- hydrolysis of cholesterol esters by cholesterol esterase to produce free cholesterol and fatty acids.
- oxidation of cholesterol by cholesterol oxidase to 4-cholesten-3-one and H2O2
- The final step again uses the ability of produced H2O2 to oxidise various compounds to coloured products in the presence of peroxidase. Phenol with 4-aminoantipyrine forms a quinonimine dye (red colour). The intensity of a red dye is proportional to the cholesterol concentration in the sample
Evaluation
reference range: 2,9–5,0 mmol/l
↑ Lifestyle, diabetes, hypothyroidism
↓ Malnutrition, hyperthyroidism
Evaluation of total serum urea
- urease cleaves urea to carbon dioxide and ammonia
- measurement of the ammonium ions generated by the urease reaction utilizes conversion of α-ketoglutarate to glutamate. The reaction is catalyzed by glutamate dehydrogenase, and coupled to oxidation of NADH to NAD+ (Warburg’s optical test).
Urease-catalysed reaction:
Urea + H2O + 2 H+ —→ 2 NH4+ + CO2
Glutamatedehydrogenase-catalysed reaction:
2 NH4+ + 2-oxoglutarate + NADH + H+ —→ L-glutamate + NAD+ + H2O
More on Warburg's optical test here.
Evaluation
Reference range: 1,7–8,3 mmol/l
↑ kidney hypoperfusion
↓ low protein diets
Estimation of serum uric acid
- Indirect evaluation: uricase converts urea to allantoin, hydrogen peroxide and carbon dioxide
- hydrogen peroxide is used in a coupled reaction catalyzed by peroxidase. A quinonimine dye is formed by oxidative coupling of 4-aminoantipyrine and a phenol derivative.
- Ascorbic acid interferes with this method; therefore ascorbate oxidase is added to eliminate such an influence
Evaluation
Reference range: women 120–340 μmol/l, men 120–420 μmol/l
↑ high purine diets (meat, organs), alcoholism, low renal clearance
↓ low purine diets
Enzymatic evaluation of serum glucose
- glucose oxidase catalyzes glucose oxidation with air oxygen producing gluconic acid in the form of its inner ester - gluconolactone plus hydrogen peroxide
- In the next reaction catalyzed by peroxidase the hydrogen peroxide reacts with a suitable chromogen, e.g. derivative of phenol that is oxidized to a reactive intermediate, which, in turn, reacts with another compound, such as 4-aminoantipyrine, yielding a stable soluble dye whose absorbance is measured
Evaluation
fasting glucose: 3,9–5,6 mmol/l, after meal below 10 mmol/l
↑ Diabetes
↓ 4 hours of biochem lab without lunch :)
Evaluation of serum calcium
Spectrophotometry of colored complexes, formed in a reaction of calcium with a suitable chelating substance like o-cresolphthalexone: with calcium ions in alkaline medium it produces a violet complex. Another such complex-forming agent is arsenazo III.
Evaluation
Reference range: 2,25–2,75 mmol/l
Higher or lower values can be the result of dysproteinemias.
Evaluation of serum iron
Reaction of iron with a complex-forming reagent.
- Release of Fe3+ from complex with transferrin by action of acids (such as HCl) or detergents
- Reduction of Fe3+ to Fe2+, e.g. ascorbic acid can be used
- Chelation of Fe2+ by the complex-forming agent (ferrozine) yielding a colored complex
Evaluation
- men: 9–29 μmol/l
- women: 7–28 μmol/l
↑ hemochromatosis, hemolysis
↓ blood loss, impaired absorbtion
Estimation of ALT
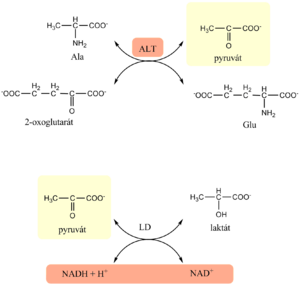
- The assay for ALT is again based on the Warburg optical test
- in the first enzyme reaction, alanine serves as donor of amino group and pyruvate is formed
- The indication reaction is catalyzed by lactate dehydrogenase that simultaneously reduces any endogenous keto acids
- Just as for AST, the procedure requires 5–15 minutes of pre-incubation, then the reaction is started with 2-oxoglutarate.
Evaluation
men below 0,8; women below 0,6 ukat/l (it's ok to remember below 1 :)
Higher values reflect hepatic cell damage.
Estimation of AST
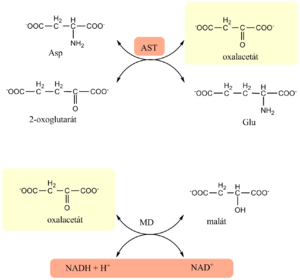
- The estimation of AST is based on the Warburg optical test
- In the first enzyme reaction, catalyzed by AST from the sample, oxaloacetate is formed
- In the next, indication reaction, malate dehydrogenase reduces oxaloacetate to malate and simultaneously oxidizes NADH to NAD+
- Activity of AST is determined kinetically as decrease in absorbance of reduced NADH at 334, 340 or 365 nm
- there is a 5-15min pre-incubation period, then the reaction is started by adding 2-oxoglutarate
Evaluation
men below 0,85 μkat/l, women below 0,60 μkat/l (just remember below 1 :)
Higher values reflect a hepatic, myocardial or muscle cell damage.
Estimation of GGT
The assay for GGT originates from the reaction that GGT catalyzes in the body. The enzyme transfers γ-glutamyl from a substrate-donor to glycyl-glycine as an acceptor. Either L-γ-glutamyl-p-nitroanilide, or L-γ-glutamyl-3-carboxy-p-nitroanilide are used as the substrate donors; the enzyme-catalyzed reaction converts them to colored pnitroaniline or 5-amino-2-nitrobenzoate, respectively. Increase in the colored product is monitored photometrically.
Evaluation
Reference range: men 0,14–0,84 μkat/l, women 0,14–0,68 μkat/l (just remember below 1 :)
Higher values typically at cholestasis and/or alcohol abuse
Estimation of ALP
ALP catalyses the hydrolysis of 4-nitrophenylphosphate to 4-nitrophenol and a phosphate
The released 4-nitrophenol, then, is a measure of ALP activity and is estimated photometrically using either kinetics or end-point approach
Evaluation
men 0,7–2,1 μkat/l; women 0,9–2,2 μkat/l
marker of cholestasis and bone disease
Spectrophotometry of CSF
This is a very short overview, see the original instructions for more
Spectrophotometry of CSF in the visible light spectrum (370-600nm) enables us to differentiate by absorbtion maxima the following:
- oxyhemoglobin (at 415nm)
- methemoglobin (at 405nm)
- bilirubin (at 420-460nm)
Evaluation
- Physiologically - a flat or very gradually descending line
- Oxyhemoglobin
- Absorbtion maximum at 415nm and two smaller peaks at 540 and 575nm
- recent subarachnoidal bleeding
- Methemoglobin
- Maximum at 415nm moves towards shorter wavelengths at 406nm. Nalézáme ho jako součást sumačních křivek, kde se absorbance jednotlivých pigmentů překrývají. Dá se však prokázat přídavkem KCN do vzorku. Pokud je přítomen methemoglobin, vznikne kyanmethemoglobin s absorpčním maximem v oblasti 419nm; v případě, že se nevyskytuje, ke změně nedojde.
- Známka starších změn hemoglobinu
- Bilirubin
- Absorbtion maximum at 460nm, conjugated bilirubin at 420nm
- Older bleeding into the liquor space.


